


 MENU
MENUMy name is Chris Berger and I’m research faculty in Civil and Environmental Engineering Department at Portland State University (PSU). I’ve been using Tecplot for over 25 years, primarily for generating contour plots, animations and x-y graphs that show water quality model predictions.
Over the past decade the research group I worked in has been the primary developer of the model CE-QUAL-W2, a 2-dimensional, width-averaged hydrodynamic and water quality model that predicts temperature, flow, water level, dissolved oxygen, pH, algae, and other water quality constituents.
How do we use Tecplot 360?
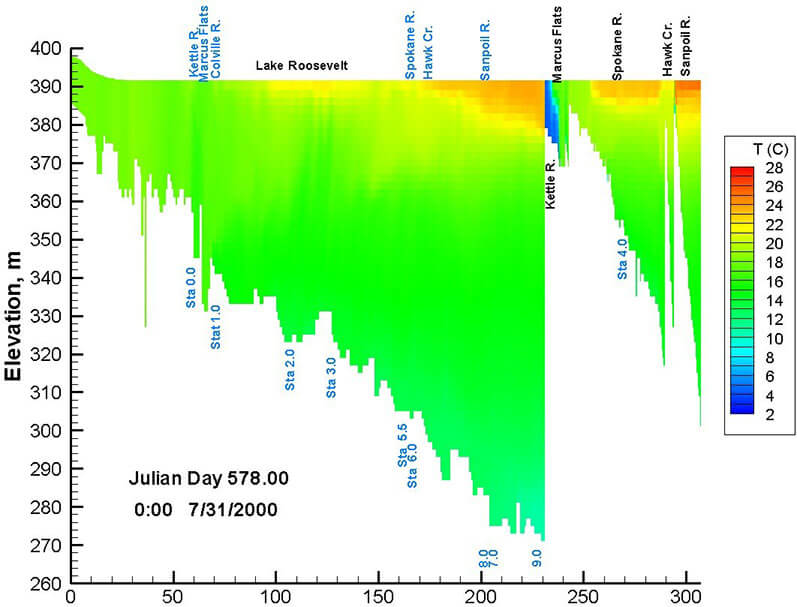
Located in northeastern Washington State, Lake Roosevelt was formed through the impoundment of the Columbia River behind Grand Coulee Dam. See more CE-QUAL-W2 projects »
When animating contour plots, Tecplot 360 is helpful in illustrating model predictions and showing how the model “works” at conferences and in meetings with clients and stakeholders.
Tecplot 360’s contour animations are also very useful in debugging and allow us to observe model predictions (lots and lots of numbers that are output by the model for different times and locations). If the model is predicting a water temperature that doesn’t make sense, we know to check inputs, and to make sure that the model is conserving mass and energy. For instance, if a river model is predicting a river water temperature of 1500 Celsius in a single model cell in the finite difference grid, we know that there is problem. In addition to debugging, animating model predictions in Tecplot 360 helps us understand why the model is making certain predictions.
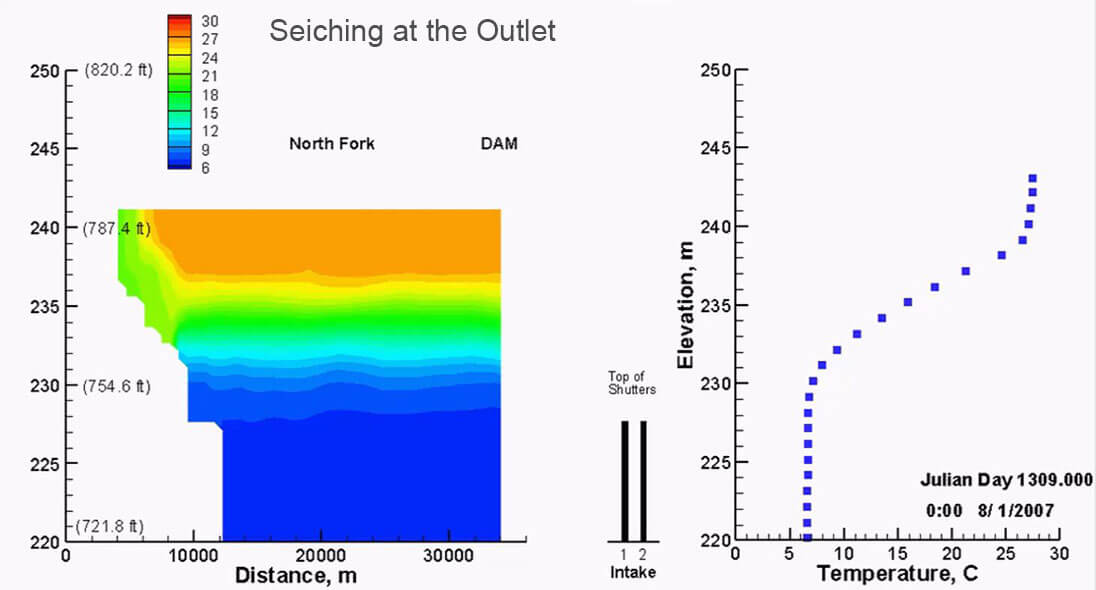
One specific instance involved Lake Whatcom near Bellingham, Washington. Lake Whatcom is mostly a deep lake with one large, deep basin connected to two other shallow basins. The basins are separated by relatively shallow sills. The bottom elevation of the sills was critical because cold water from the deep basin would “leak” into the shallower basins. We were confused about the measured water temperatures in the shallow basins and by creating a model in Tecplot 360 we were able to understand what was happening.
If we need to make many plots, we use the macro abilities of Tecplot 360. We also use macros to post-process model predictions to create static x-y plots. We usually generate WMF images which are then imported into our reports and PowerPoint presentations.
Portland State University’s Water Quality Workshop
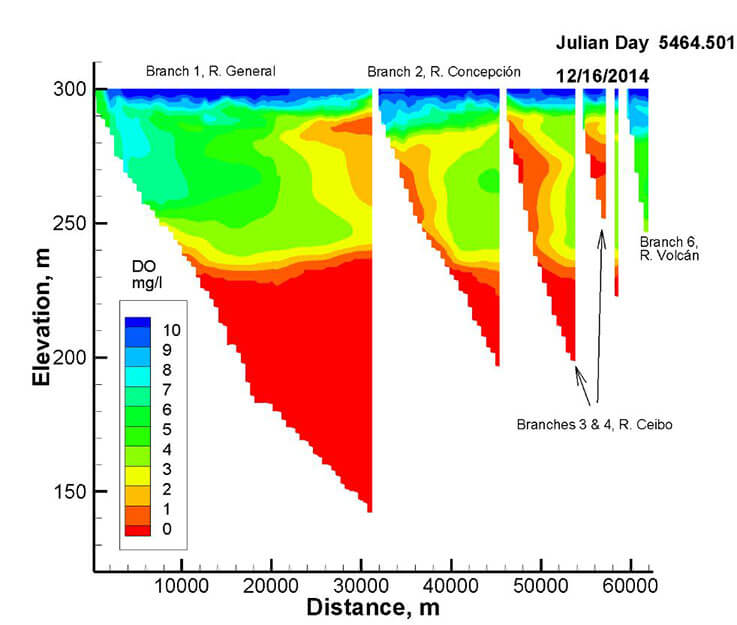
El Diquis, Costa Rica
The next workshop is June 17-21, 2019 at the PSU campus.
We also use Tecplot 360 for the annual Water Quality Workshop that we teach every June. In the computer lab section of the workshop, we use Tecplot macros to rapidly process the predictions of the model example problems that the participants are working on. This allows participants to learn more quickly about the CE-QUAL-W2 model and learn more about Tecplot 360!
The class is taught to professionals (engineers, managers and scientists) who would like to apply the water quality model CE-QUAL-W2. Over the past decade, Portland State University has been the primary developer of CE-QUAL-W2.
Oroville, California