


 MENU
MENUThis case study was contributed by Jonathan Whiting, a member of the hydrodynamic modeling group at Pacific Northwest National Laboratory in Washington State. He has been a Tecplot 360 user since 2014.
Promoting Restoration of the Salish Sea
Pacific Northwest National Laboratory (PNNL) is a U.S. Department of Energy laboratory with a main campus in Richland, Washington. Jonathan Whiting is part of the Coastal Sciences Division at PNNL’s Marine Sciences Laboratory. The hydrodynamic modeling group in Seattle works primarily to promote both ecosystem management and the restoration of the Salish Sea and Puget Sound using the Salish Sea Model. (Geographic boundaries of Puget Sound and the Salish Sea are explained here.)
Salish Sea Predictive Ocean Model
The Salish Sea Model is a predictive ocean modeling tool for:
- Coastal estuarine research
- Restoration planning
- Water-quality management
- Climate change response assessment
It was initially created to evaluate the sensitivity of Puget Sound acidification to ocean and fresh water inputs and to reproduce hypoxia in the Puget Sound while examining its sensitivity to nutrient pollution. Now it is being applied to answer the most pressing environmental challenges in the greater Salish Sea region.
This effort is funded by the Washington State Department of Ecology.
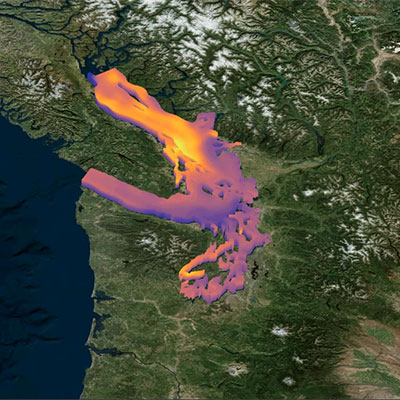
Salish Sea with georeferenced Image.
Making Results Available to the Public
Creating Consistent High-Quality Visualization
The hydrodynamics modeling group uses the Finite Volume Community Ocean Model (FVCOM) simulation code.
For the recent Skagit Delta Hydrodynamic Modeling project, a high-resolution triangular unstructured grid was created with 131,471 elements and 10 terrain-following sigma layers in the vertical plane. Post-processing was conducted on five time snapshots per scenario across 11 scenarios (including a baseline). Each file was about 55MB in uncompressed binary format.
The sheer quantity of plots was very challenging to handle, and it was important to generate clean plots that clearly conveyed results.
Visualizing Parameters Geospatially
Tecplot support and development teams have been working closely with Jonathan, especially by adding new geospatial features to the software that enhance its automation and efficiency.
According to Jonathan, the key strengths in Tecplot’s software have been:
- Ease of use
- Scripting to assist bulk processing
- Tools such as georeferenced images
Tecplot 360 allows Jonathan to create professional plots that enhance the impact of his modeling work.
How Will Jonathan Use Tecplot In the Future?
Jonathan’s personal niche has become trajectory modeling. And so he is also interested in using Tecplot 360 to generate visuals associated with the movement of objects on the surface. This is done by using streamlines, velocity gradients, slices and more. He intends to take a deeper dive into the vast capabilities of Chorus and PyTecplot in the future!
Tecplot 360 includes the popular FVCOM loader and has the ability to insert georeferenced images that put your data in context. Tecplot 360 will automatically position and scale your georeferenced Google Earth or Bing Maps images.
View our Video Tutorials for Geoscience Applications »