


 MENU
MENUEcosystem Modeling Plays a Key Role
The University of Maryland Center for Environmental Science (UMCES) leads the way towards better management of Maryland’s natural resources and the restoration of the Chesapeake Bay. Blake Clark earned his PhD from UMCES at Horn Point, located on Maryland’s Eastern Shore, where ecosystem modeling plays a key role in research efforts focused on water quality, oceanography, and restoration of sea grasses, marshes, and shellfish.
Blake is currently conducting research as a post-doctoral fellow in the Ocean Ecology Laboratory at Goddard Space Flight Center.
“Pollution Diet” to Restore Clean Water
In 2010, the U.S. Environmental Protection Agency established the Chesapeake Bay Total Maximum Daily Load (TMDL), a historic and comprehensive “pollution diet” to restore clean water in the Bay and its streams, creeks, and rivers. State-of-the-art modeling was essential to establishing the pollution limits and continues to be crucial to ensuring that the measures are effective and fully implemented by the 2025 deadline for overall nitrogen, phosphorus and sediment reductions. Adjusting the model to account for climate-related impacts has been one of the challenges facing modelers over the past few years.
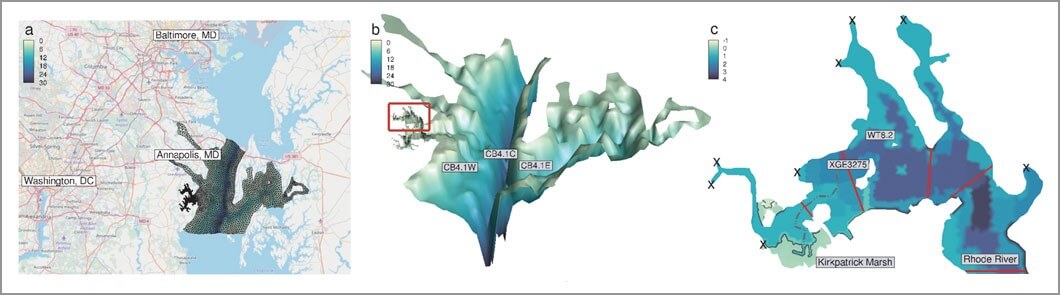
The middle Chesapeake Bay region comprising the ecosystem model domain with the Rhode River estuary highlighted.
Cutting-Edge Modeling Work
Blake’s research on the Rhode River, a tributary of the West River in Maryland’s Anne Arundel County, is emblematic of the cutting-edge modeling work occurring on the Chesapeake. He investigated dissolved organic matter, a contributor to nitrogen and phosphorus levels in river and stream systems. Dissolved organic matter can also play a role in regulating the Earth’s climate, because some matter is converted to CO2. He and his team used both field observations and modeling tools to document the fate and transport of this dissolved organic matter in the Rhode and advance efforts to explicitly include tidal wetlands in estuarine organic matter budgets.
The team’s research provides insights into how estuarine ecosystems may respond to future pressures and how the services these ecosystems provide may be altered in a changing climate. The research was funded by NASA’s Research Opportunities in Earth and Space Science (ROSES) program.
A Three-Dimensional Model
Blake and his team created a three-dimensional model of the Rhode River sub-estuary to provide a realistic representation of intertidal marsh hydrodynamics. An important aspect of the model is showing fluxes of dissolved organic matter, incorporating both marsh-estuary matter that is generated through marsh root decay in sediments and diffusion into the water column. Documenting the flux is crucial to understanding the relative importance of the various inputs and reactions over daily and longer-term (such as seasonal) scales and provides insights into carbon and nitrogen transfer in the system.
Blake took the following steps to create a transect analysis for the Rhode River dissolved organic matter model:
- Loaded the model with both hydrology and water quality information;
- Drew curved transects and extracted the data from the transect;
- Rotated velocity data on the transect to calculate both diffusive and advective (or horizontal movement) fluxes;
- Aggregated the fluxes through the transect and obtained a time series of it.
Correcting Bugs in the Ecosystem Model
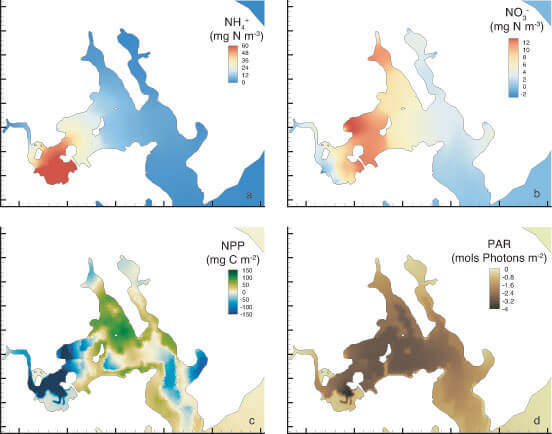
The difference in Ammonium (a) Nitrate (b) net primary production (c) and photosynthetically available radiation (d) in model runs with and without a tidal marsh at the head of the estuary.
Blake leveraged the FVCOM-loader that is built in Tecplot 360. To overcome large initial text outputs, he moved to netCDF outputs, which allowed him to save data at a finer temporal frequency and provided a more detailed picture of tidal dynamics.
According to Blake, Tecplot 360’s addition of an FVCOM-loader allowed him to load the data directly, without translation, and enabled him to see the data both in 3D and temporally. The ability to interact with 3D data and animate though time helped him discover and correct bugs in his model that may have otherwise gone undetected. “Static images and 2D plots make it difficult to find these areas of inconsistency,” he says.
Viewing the Transect in the 3D Scene
Blake then used the geometry tool to interactively draw the way points of a transect and performed a data extraction of 200 points along the transect. With that information, he used a PyTecplot, Tecplot’s Python API, script to compute distance along the transect and extract data that were in a plane with the transect. According to Blake, Tecplot 360, via PyTecplot, made it easy to create a vertical transect and to view that transect in the 3D scene. This step was easier to accomplish than it would have been with other tools, and also unique in providing the ability to view the transect in the 3D scene, which gave Blake a better context of the data.
He then rotated two sets of vectors onto the transect and computed the various fluxes to get views of velocity, diffusion, and total amount of organic matter transport over time.
Solving the Pressing Problems Facing our Planet
According to Blake, “I want to be a part of the community of Earth scientists trying to solve the pressing problems our planet faces.” As he and his Horn Point colleagues develop complex and unique 3D biogeochemical modeling techniques to facilitate the restoration of the Chesapeake Bay, Tecplot’s cutting-edge tools are playing a role in their success.
Tecplot 360 includes the popular FVCOM loader and has the ability to insert georeferenced images that put your data in context. Tecplot 360 will automatically position and scale your georeferenced Google Earth or Bing Maps images.
View our Video Tutorials for Geoscience Applications »