


 MENU
MENUTecplot Product Manager
If you’re anything like me, you probably played with LEGOs as a kid (and probably continue to play with LEGOs as an adult).
I love LEGOs for the fact that you can take just a few building blocks and make nearly anything you want out of them. But LEGOs can be frustrating when you can’t find the one piece you need for your project.
 In my years at Tecplot I’ve started to think of Tecplot 360 and PyTecplot like LEGOs. There are a lot of building blocks that can help you do many types of visualization and analysis. Some building blocks are easy to find (like slices, iso-surfaces, and streamtraces), but other building blocks are a bit harder to find (like spanwise integrations and time averages).
Thankfully Tecplot has a team that can help you find these build blocks if you’re having a hard time finding them yourself (kind of like my mom, who could always find the LEGO piece when I needed it).
That’s great Scott, but what’s the point?
We recently had a user contact us wanting to “extract a line that represents the minimum pressure location as a function of Z.” Whew – now that’s a building block that’s hard to find. Sometimes you need to build your own – so that’s what Tecplot support engineers did for this user.
Let’s set up the problem
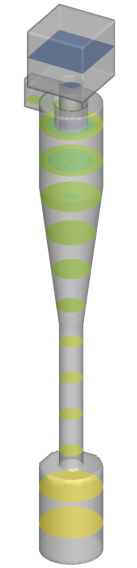
 This user has Tecplot for Barracuda to visualize their results from Barracuda Virtual Reactor. They want to understand where the minimum pressure is throughout the height of their cyclone. With Tecplot 360 you can easily create a series of slices (as pictured at left) to visually understand the minimum pressure location. But it can be challenging to see this visually since the pressure values vary so much in the vertical direction you get little variation across each slice.
So you can see the need for a more quantifiable approach.
PyTecplot to the rescue
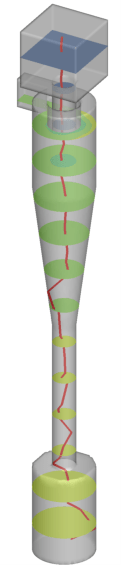
PyTecplot, the Python API of Tecplot 360, gives you direct access to the raw data in your simulation results. Using PyTecplot we were able to extract the minimum pressure location at defined Z-locations within the volume. With the set of XYZ minimum pressure locations we were then able to generate a new zone which is the “line that represents the minimum pressure location as a function of Z.”
Sure, this took a few lines of Python (about 30 lines), but through the power of Tecplot 360, PyTecplot, and an amazing technical support staff, we were able to use the building blocks provided by Tecplot products to build an analysis routine that we hadn’t seen before.
Support and GitHub
An example of the script is on the Tecplot GitHub site. And the next time you’re working on an analysis problem and can’t find the LEGO piece you need, make sure to call mom, er, I mean support@tecplot.com