


 MENU
MENU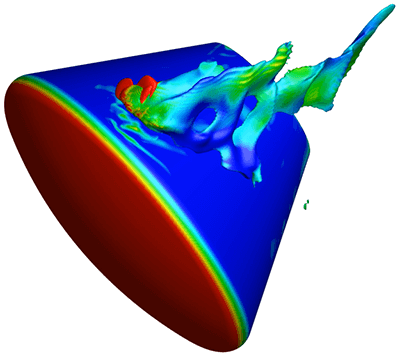
The CFD Work That Helped Bring Orion Home
As the Artemis II crew re-enters Earth’s atmosphere, the heat shield keeping them safe was shaped in part by thousands of CFD simulations visualized with Tecplot 360. […]
As the Artemis II crew re-enters Earth’s atmosphere, the heat shield keeping them safe was shaped in part by thousands of CFD simulations visualized with Tecplot 360. […]
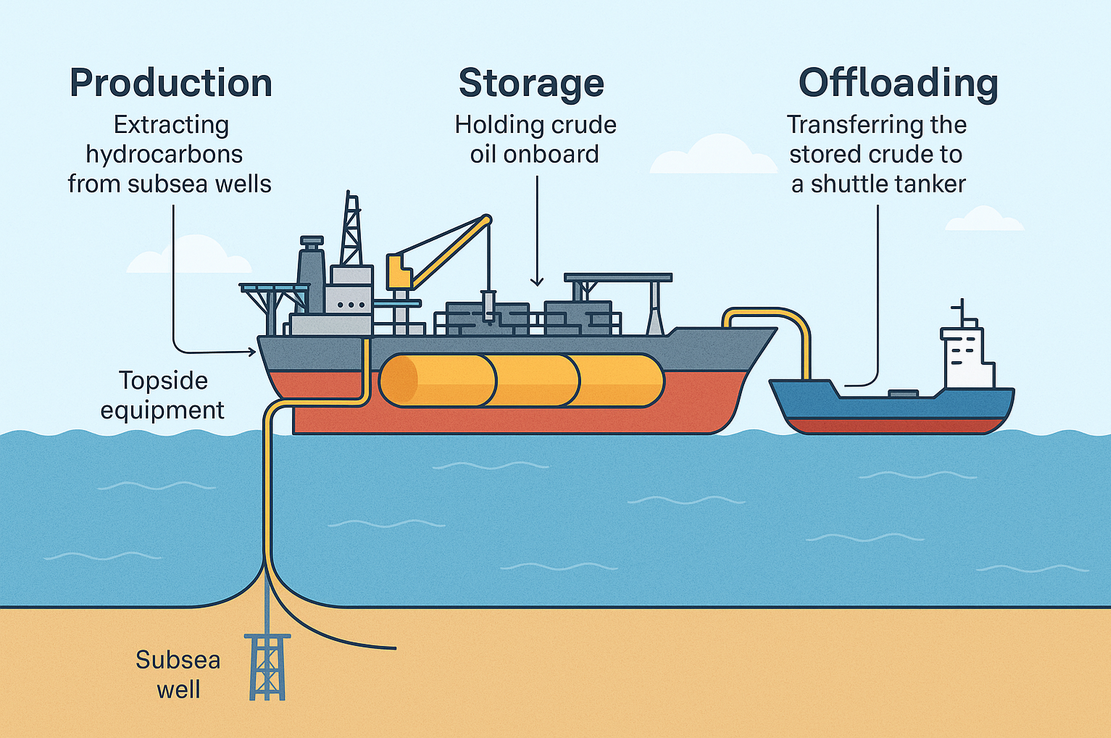
FPSO design and CFD go hand-in-hand. Learn how engineers use CFD to solve common FPSO design challenges. […]
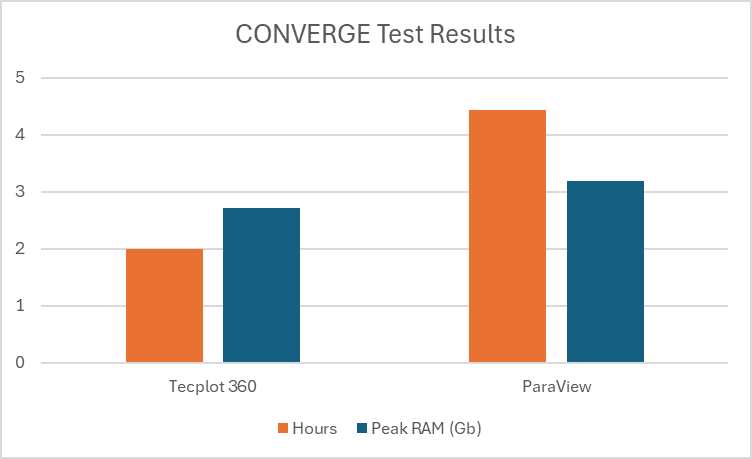
Here’s why Tecplot post-processing software is superior to open-source tools for automotive CFD. […]

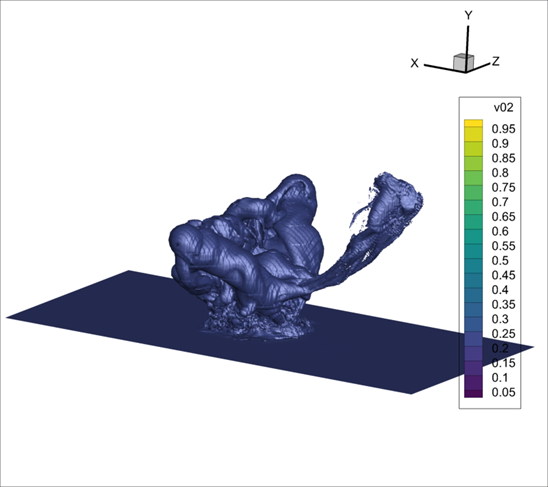
In this article, we’ll show you how to visualize and analyze M-Star results with Tecplot 360. […]
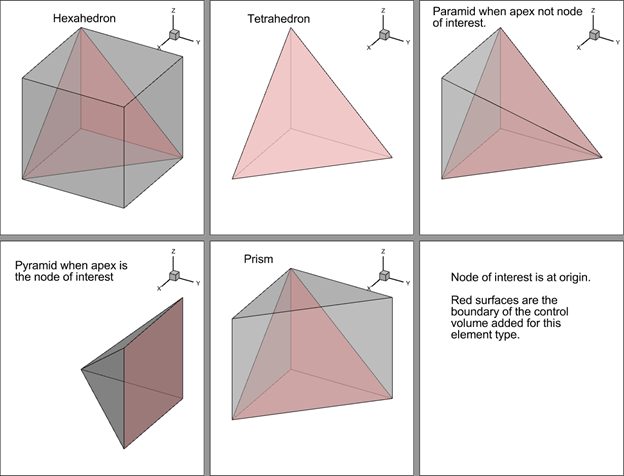
With the release of Tecplot 360 2024 R1, we have introduced the Green-Gauss method for computing derivatives as a Beta feature. […]
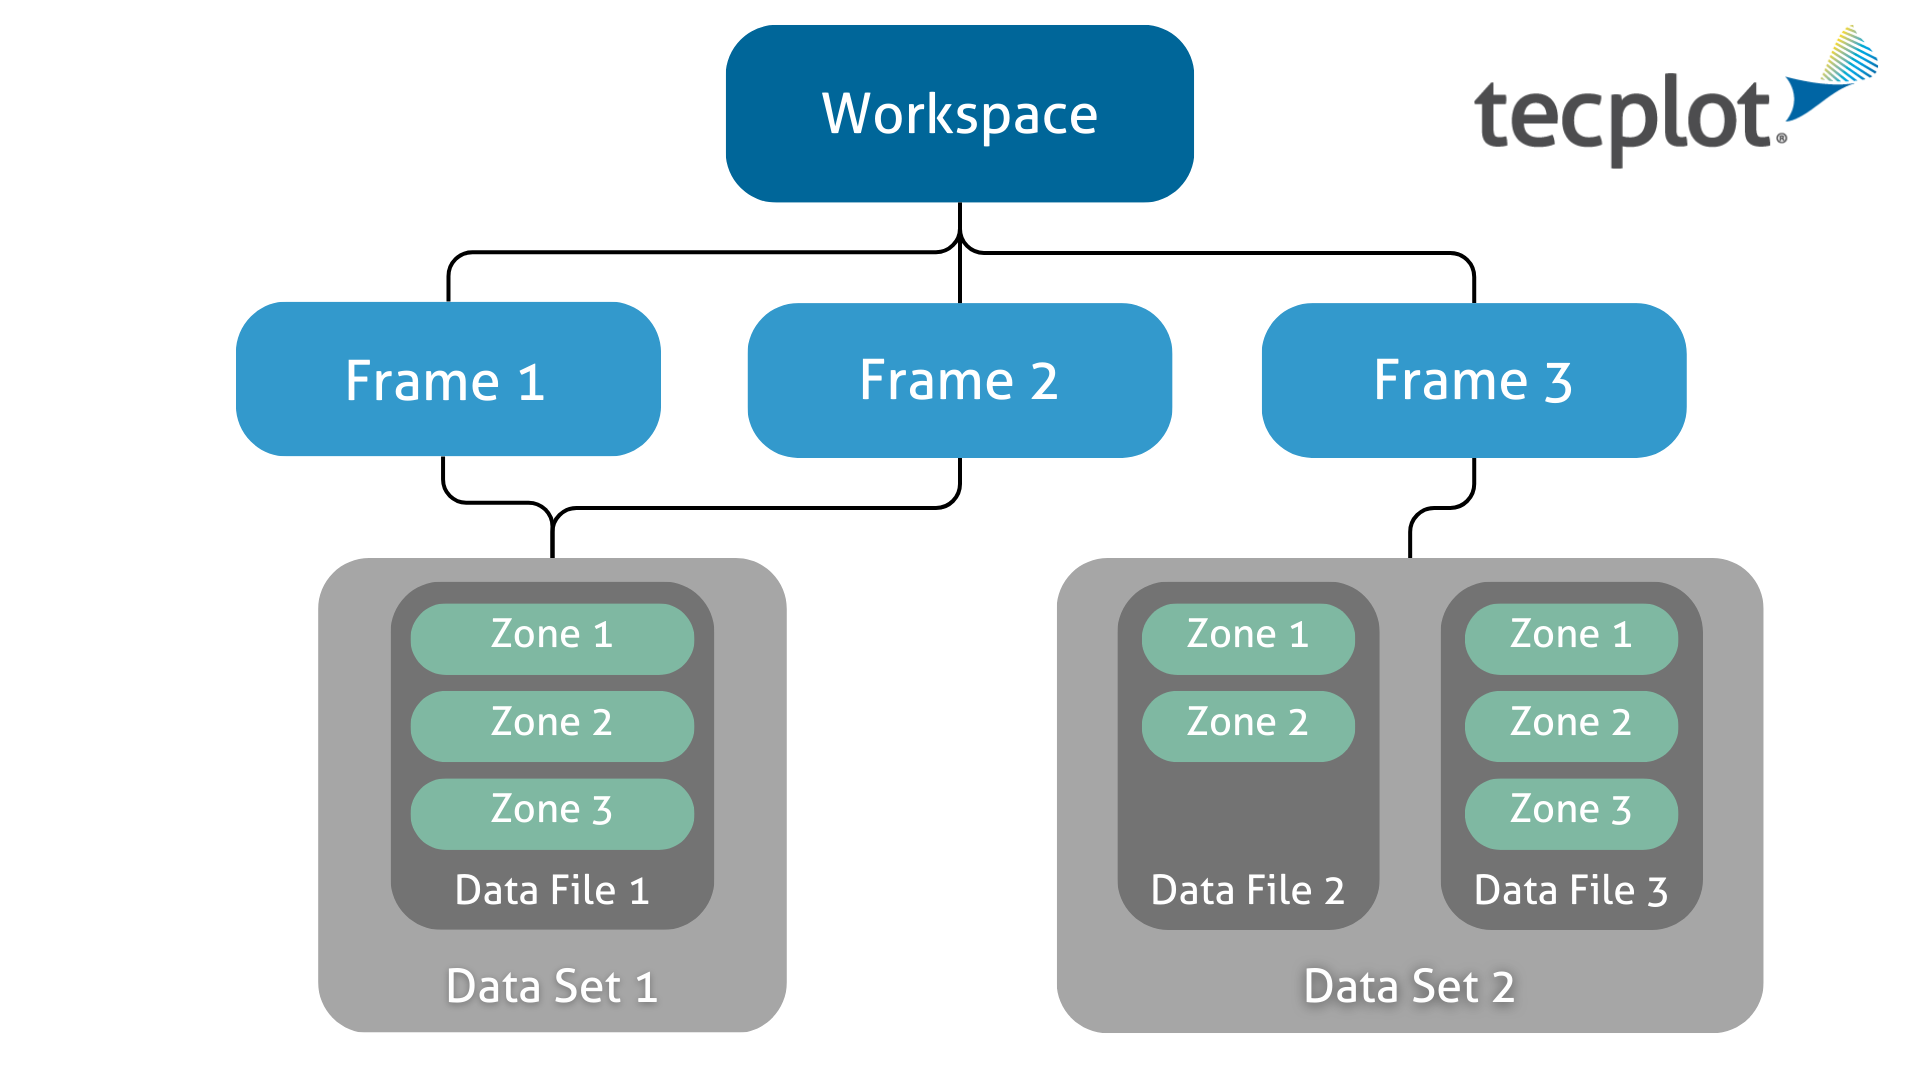
In this blog, we’ll guide you through a glossary of unique Tecplot terms that often get brought up in support inquiries and training. […]
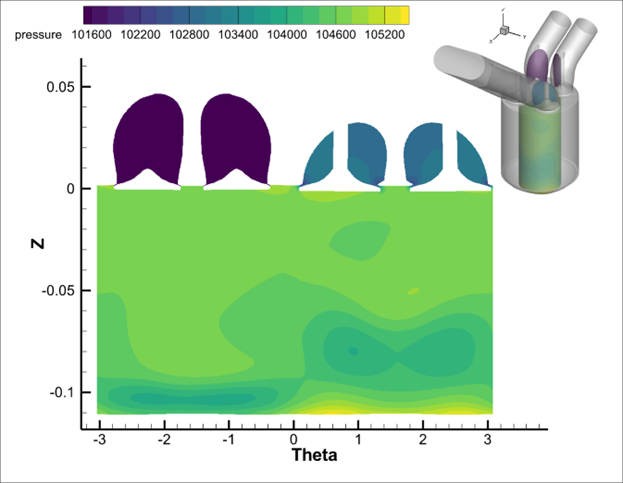
This article will help you understand how to create and unwrap a cylindrical slice and how to properly display it in Tecplot 360. […]
The Tecplot 360 and FieldView teams have made the investment to add and improve support for VTK File Formats. […]
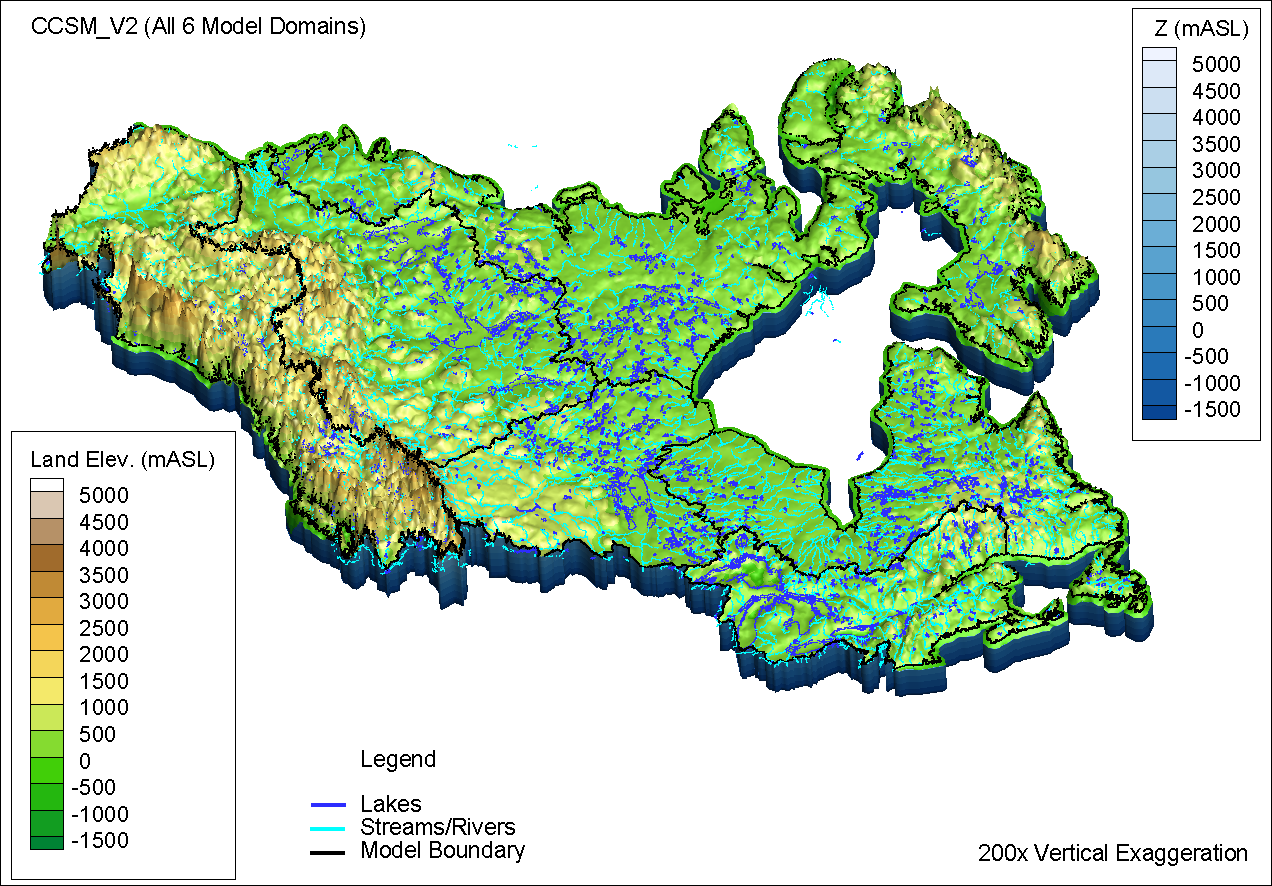
Aquanty’s HydroGeoSphere modelling relies on Tecplot 360 to achieve a deeper insight into hydrologic systems. […]
In this blog post, we’ll reveal how the Tecplot team used a Python module called PyQt with PyTecplot and open-source color palettes to create a customizable GUI to speed-up the creation and manipulation of line plots in Tecplot 360. […]