


 MENU
MENUIf you’re just starting out with Tecplot 360, you may stumble over a handful of terms that aren’t common-knowledge or widely used in other CFD post-processing tools. From frames to zones and blanking to derived objects, understanding these terms will help you unlock the full potential of Tecplot’s capabilities. In this blog, we’ll guide you through a glossary of unique Tecplot terms that often get brought up in support inquiries and training.
Frame
We’ll start with frames–the frame is the window through which you view your data and create plots. When you initially open Tecplot 360 there is a single frame. At any given time, Tecplot 360 acts upon only one frame, the active frame. The active frame is identified by a darker, thicker border and any dialogs will affect the active frame.
You may add additional frames which can share the data from another frame or load entirely different data. Frames may be sized and positioned independently to produce the view of your data that you want. Here is a helpful graphic for understanding terms like frames in relation to how data is organized in Tecplot 360:
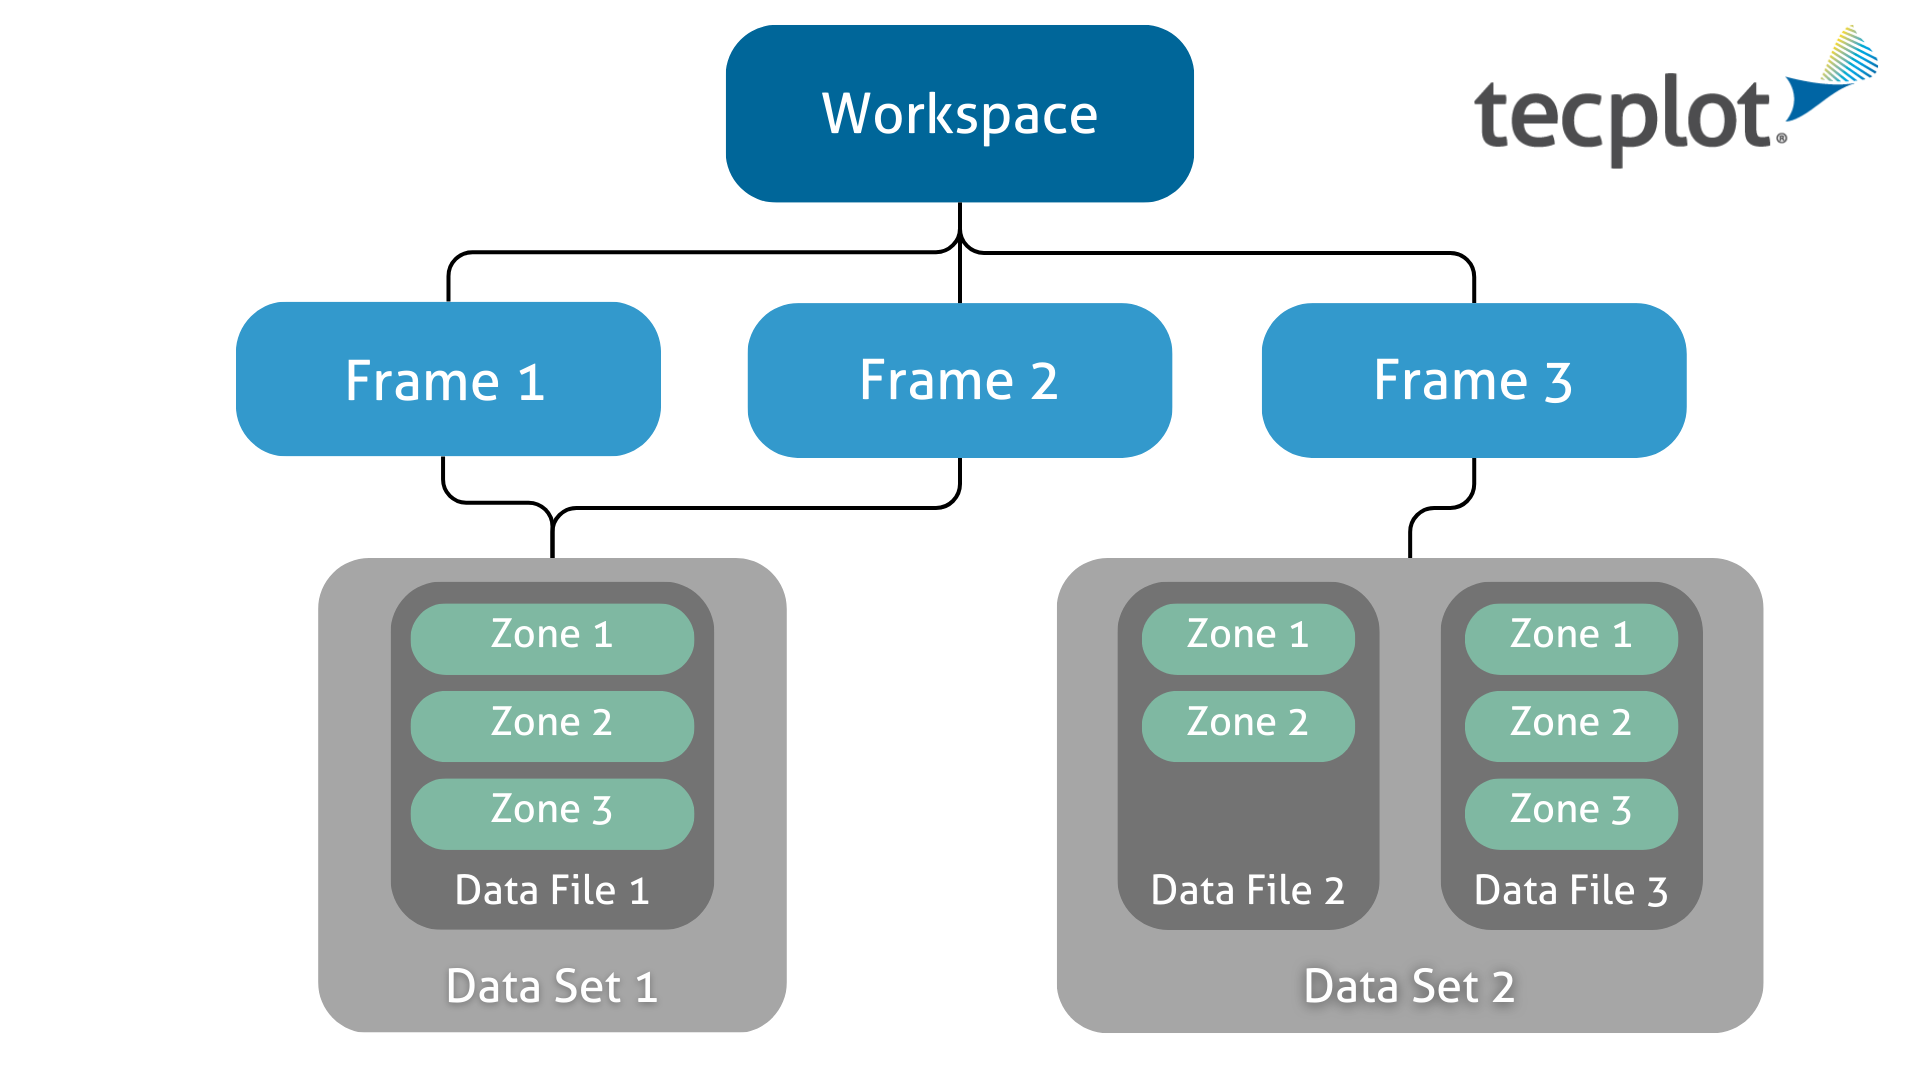
Data Hierarchy in Tecplot 360. Frames 1 & 2 display Data set 1, and Data set 1 contains three zones from one data file. Frame 3 contains Data set 2, which is composed of five zones (two from data file 2 and three from data file 3). You can learn more about how data is organized in the Tecplot 360 User’s Manual here.
Data Set
A data set is defined as “all of the data in a frame”. To create a data set, load one or more data files into an empty frame in Tecplot 360.
Derived Objects
Derived objects in Tecplot 360 consist of Slices, Iso-surfaces, and Streamtraces. These are lightweight objects that are derived from surface or volume data and can be easily turned on or off. A limitation of derived objects is that you cannot access the raw data, execute calculations, or integrations on them. You must first Extract these objects to a zone to perform calculations or access the raw data. Once extracted to a zone you may turn on/off or reposition the derived object and no changes will occur to the extracted zone.
Page
Tecplot 360 allows for multiple pages, which are like Sheets in Excel or Tabs in a web-browser. Each page may have one or more frames. Multiple pages allow additional flexibility in how data are organized and presented within Tecplot 360. You can manage multiple pages in Tecplot 360 using the Pages sidebar, shown in the image below. For more information, check out a video describing pages here.
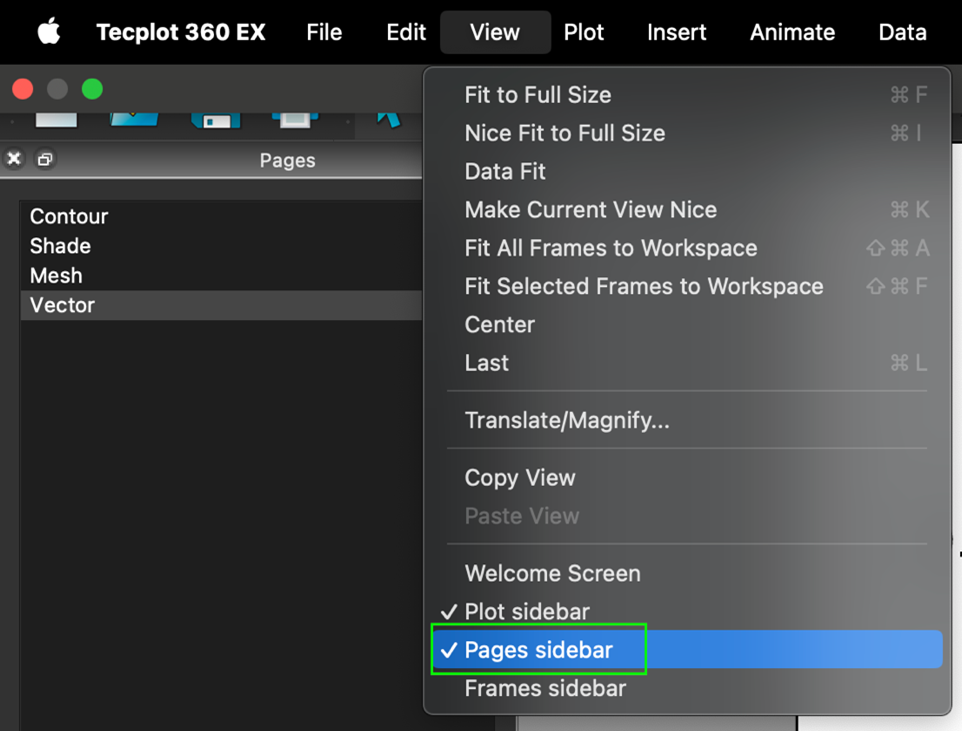
You can view and create different pages by going to View in the main menu and toggling on the Pages sidebar.
Zone
A zone is Tecplot 360’s basic data type. Zones can be of many different dimensionalities. For 0D (particles) or 1D (line) data, you would use an I-Ordered zone, in which each data point is connected to the adjacent point (simply don’t draw the Mesh for particles). For 2D data you might use data that consists of quadrilaterals or triangles. For 3D data your data would consist of hexahedrons, tetrahedrons, etc.
For physical objects, each zone typically represents a different physical object. For example, an airplane could consist of three zones: ‘wing’, ‘fuselage’, and ‘tail’. Separating these into individual zones allows more flexibility in how the data can be represented (see field maps below) and analyzed. If the dataset is transient, then there would additionally be one zone for each part at each time step (see time strands below).
Each zone will also typically have variable data that represents different physical aspects of the data – such as X,Y,Z to define the geometry/position. Your data may also have attributes such as Pressure, Temperature, and Velocities.
For more info on zones, variables, and data sets watch the video below.
Specify Equations
The Specify Equations dialog, found under the main menu under Data>Alter>Specify Equations (or via the f(x) symbol in the toolbar), can be used to create new variables or modify existing variables using an equation. For more tips on using Specify Equations, see this video on our website.
Time Strands
A time strand is a way to identify a set of zones as being part of a time series. Assume we have an airplane with 10 timesteps and split into zones for the ‘wing’, ‘fuselage’, and ‘tail’. In this case, we’d have 30 zones: 10-timesteps x 3-parts. We’d organize the data as such:
- Time Strand #1 = “wing”
- Time Strand #2 = “fuselage”
- Time Strand #3 = “tail”
As you can see here – a time strand is simply a numeric value that identifies “like-data” through time.
For more information, see the Time Aware section of the 360 User’s Manual. You can see the Time Strand value (also known as Strand ID) and Solution Time of a zone easily from the Data Set Information dialog (Data>Data Set Info…) in the image below.
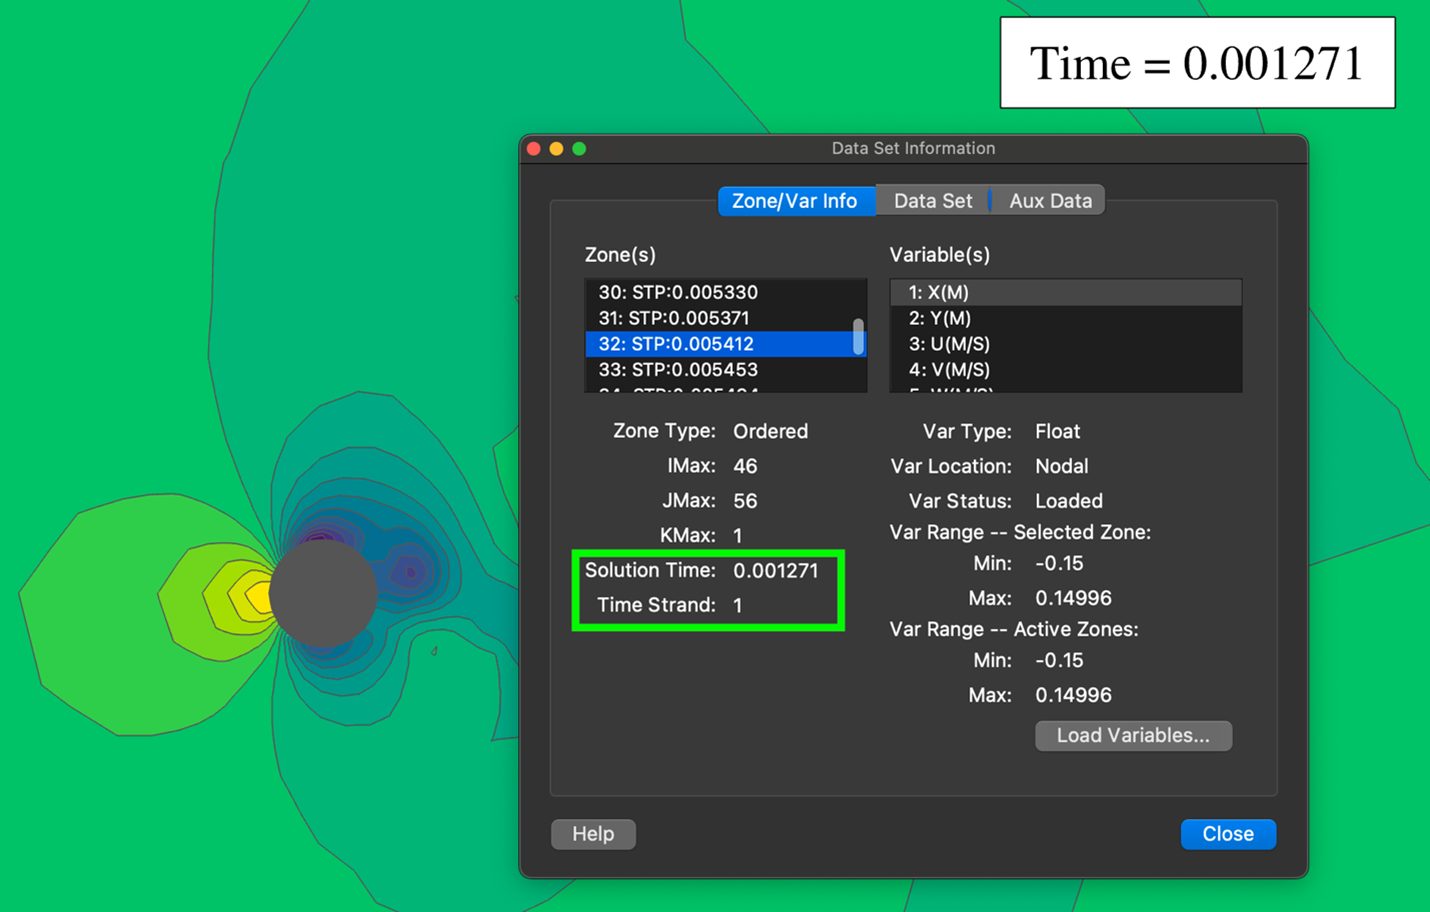
You can find all the solution time and time strand info associated with a zone in the Data Set Information dialog.
Field Map
A field map defines the style which is applied to a zone. Each row in the Zone Style dialog represents a single field map. For non-transient data, Tecplot 360 will create one field map per zone. For transient data, Tecplot 360 will provide one field map per time strand – this way you only need to adjust the style for your “wing” once and that style will be honored throughout the time series.
The asterisk (“*”) in the Zone Number column indicates the zone is part of a time strand.
In the plot sidebar in 2D and 3D Cartesian mode, you can control different global zone layers called: Mesh, Contour, Shade, Vector, Edge, and Scatter. Different zone layers plot different aspects of zones. You can control which of these layers are specifically plotted for individual zones by going to the Zone Style dialog which is used to control the Field Map style. You may also change the Field Map style via a Context Menu by right-clicking on a particular zone of interest, which is pictured below.
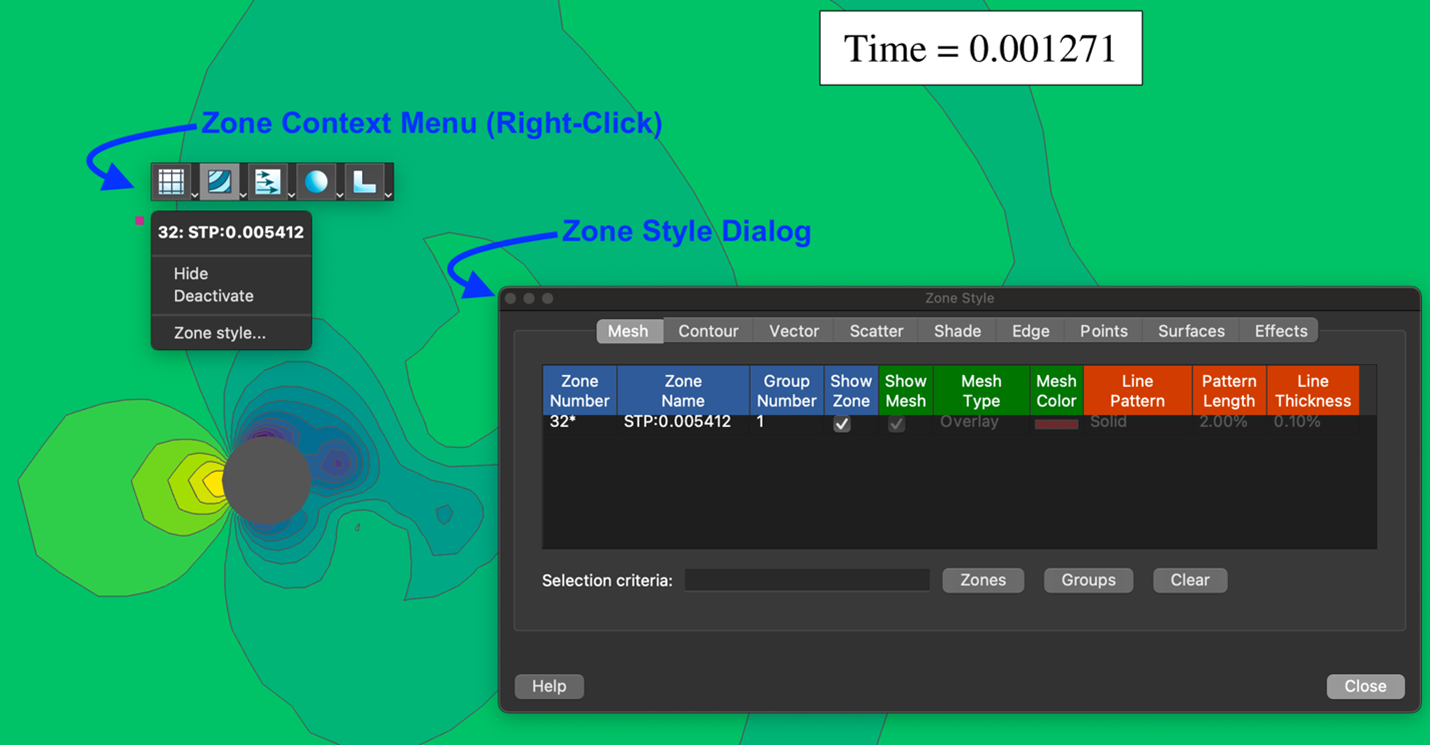
Control zone style on a per zone basis with the Zone Context Menu (accessible by a right-click on a zone of interest) and Zone Style dialog.
Blanking
Blanking acts as a filter and allows you to exclude specific portions of zones or derived objects from being plotted based on variable values. Value blanking (found under Plot>Blanking>Value Blanking…) is particularly useful to see inside 3D objects, control I-Blanking with PLOT3D data, and eliminate data that should not be used in computations (such as integrations).
Summary
In summary, getting familiar with the unique terms in Tecplot 360 will help you gain confidence with the software, simplify your workflows, and lead to a deeper level of understanding which can fuel new discoveries. If there are still terms or concepts that you’d like clarification on, check out the search feature in the upper right-hand corner of our website. Tecplot’s search feature can sift through the entire website to help you find what you’re looking for, including documentation, training, and videos. Evaluators and TecPLUS users also have access to our support team who can answer any questions about Tecplot 360 that might come up. Happy Tecplotting!