



 MENU
MENUBlog contributed by Raja Olimuthu, Tecplot RS Product Manager
As Product Manager for Tecplot RS, I spend a lot of time talking with our users about what gets in the way of their work. Sometimes it’s a feature they’ve wanted for years. Sometimes it’s a workflow that takes too many steps. And sometimes, the size of the case limits what you can realistically do with it. Tecplot RS 2026 R1 addresses all three.
There are a lot of improvements in this release that I’m excited about, but I want to highlight a few that I think meaningfully change what you can do in RS.
Vulkan Graphics Engine – Game Changing
The biggest change in Tecplot RS 2026 R1 is under the hood: our new Vulkan-based graphics engine. And the difference is dramatic.
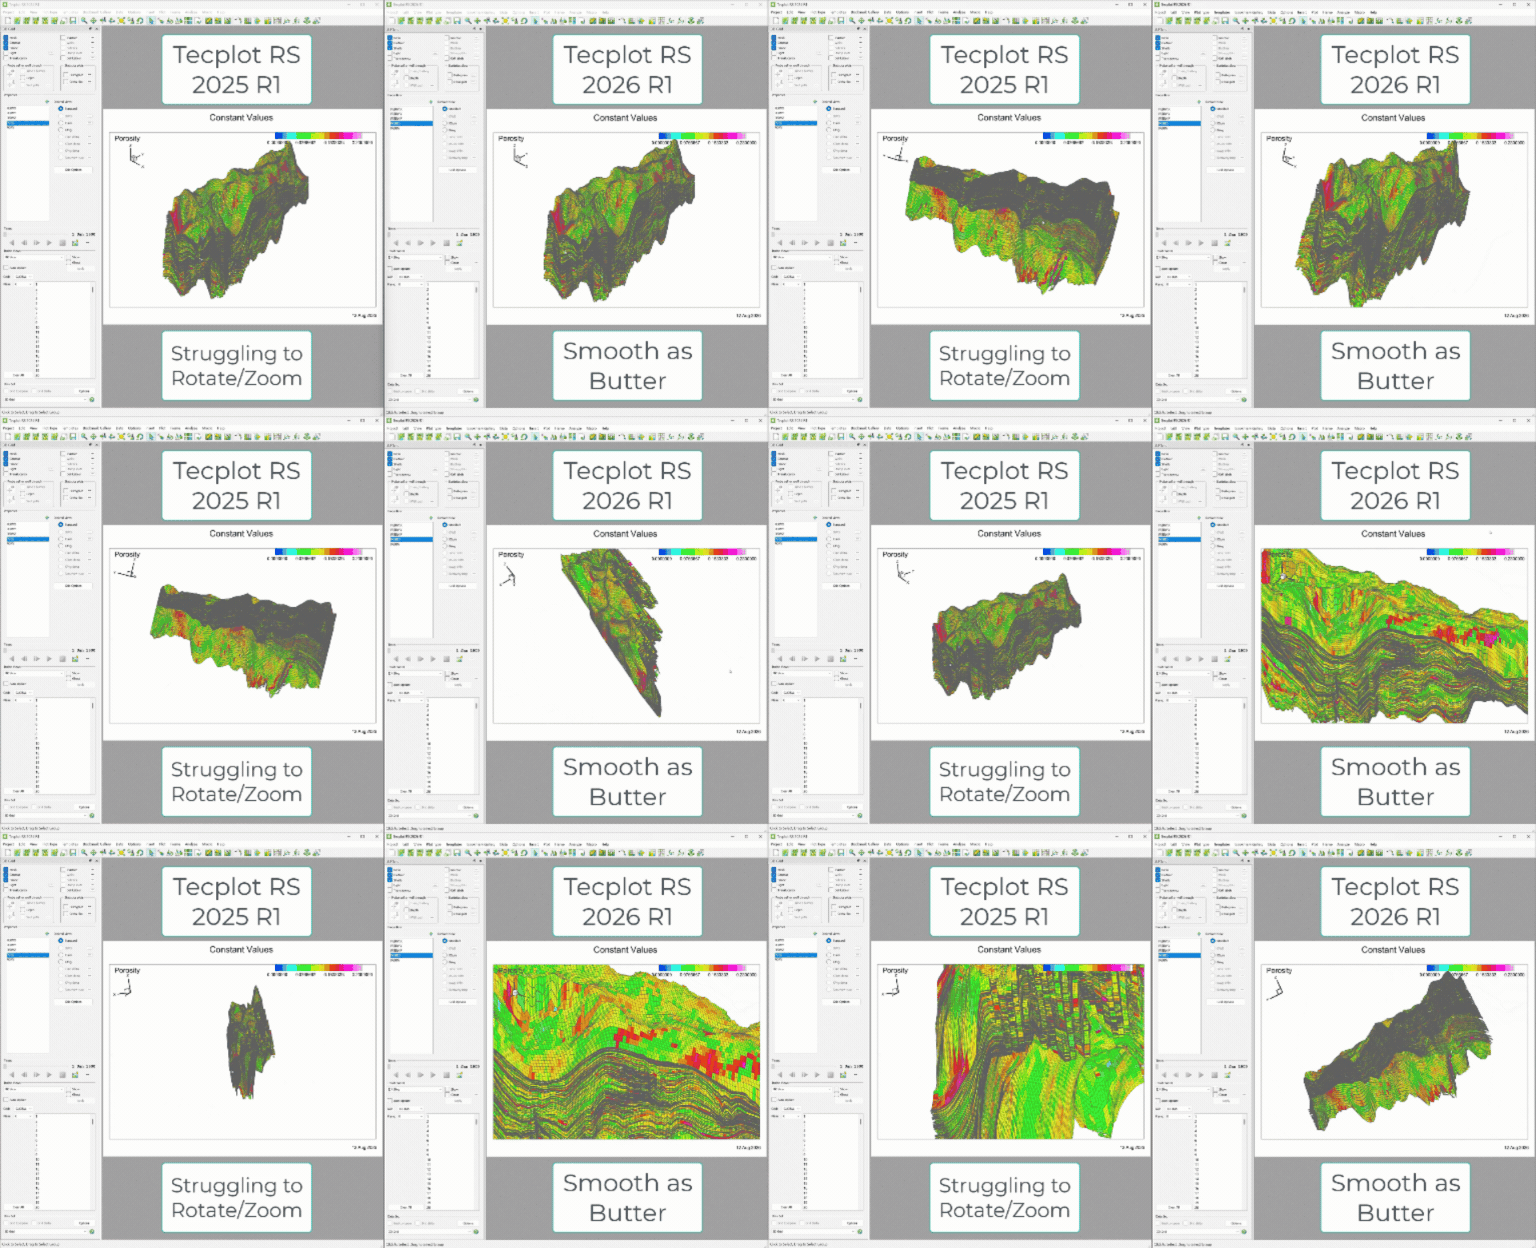
One of the cases we’ve been testing really shows the difference. It’s a 400-million-cell model with a GRID file over 70 GB in size. In Tecplot RS 2025 R1, the model was extremely difficult to work with interactively. Even basic exploration like rotating the model or changing the view was slow enough that it limited what you could realistically do with the case.
In Tecplot RS 2026 R1, that same model is smooth and responsive. You can rotate it, move around the reservoir, and interactively explore a model that previously pushed the limits of what you could work with in RS.
Reservoir models aren’t getting smaller. Engineers are working with increasingly detailed grids, more properties, more timesteps, and large simulation results. With this graphics work, we’ve significantly expanded the scale and complexity of the cases you can interactively explore in Tecplot RS. For our users, this means cases that were previously too large to explore are now within reach, opening up new possibilities for what they can analyze in Tecplot RS.
RFT Analysis: Multiple Entities, One View
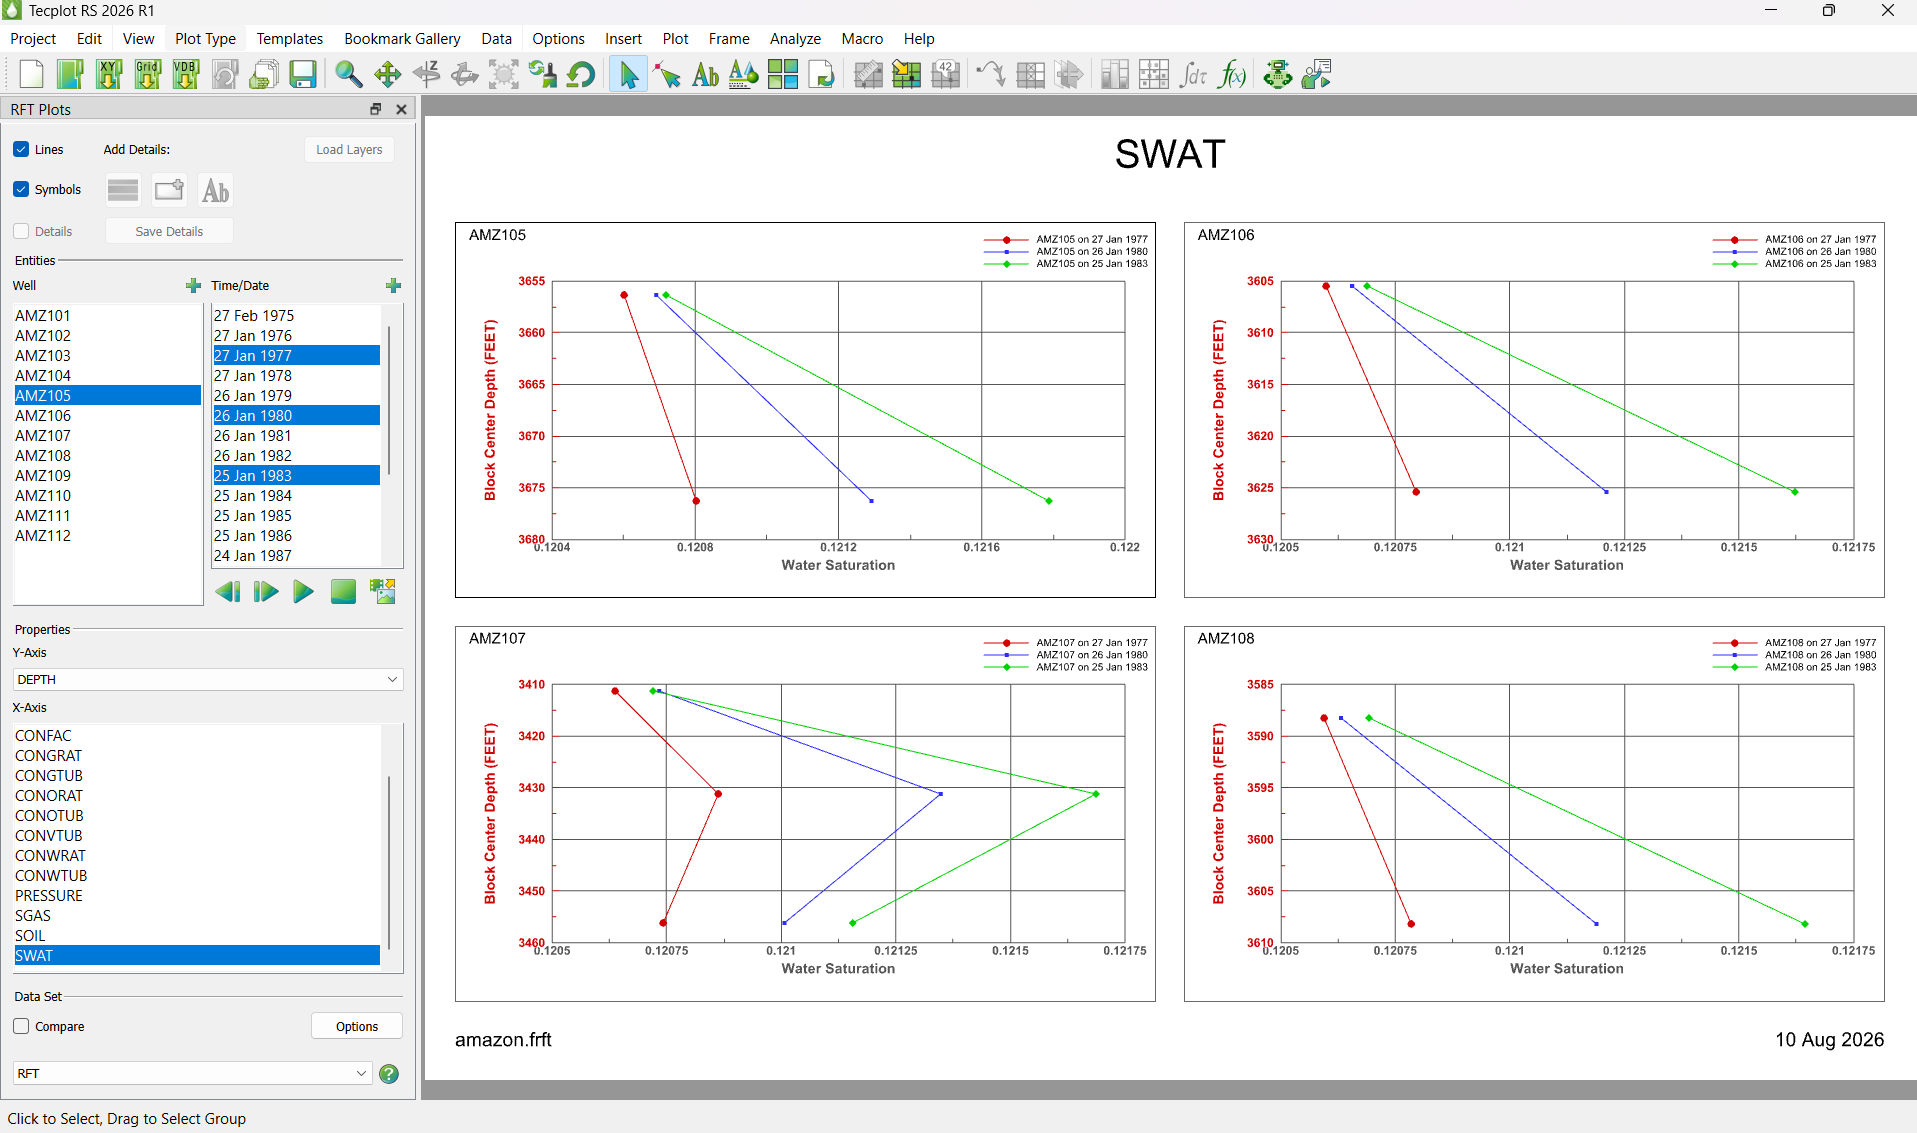
Multi-Frame support for RFT plots is something our users have requested for quite a while, and I’m very happy to see it arrive in this release. Instead of moving back and forth between individual RFT plots, you can now build a view with multiple wells or other entities displayed side by side and compare their behavior in one place.
Within each RFT plot, you can also display multiple simulation timesteps along with the corresponding historical data. This gives you another level of comparison — not only across different entities, but also across time and against the measured data.
Put those capabilities together, and you can get a lot of useful information into a single view. You can quickly compare how different wells are behaving, see how the simulation changes over time, and understand how those results line up with historical measurements.
A Clearer View of Faults and Reservoir Behavior
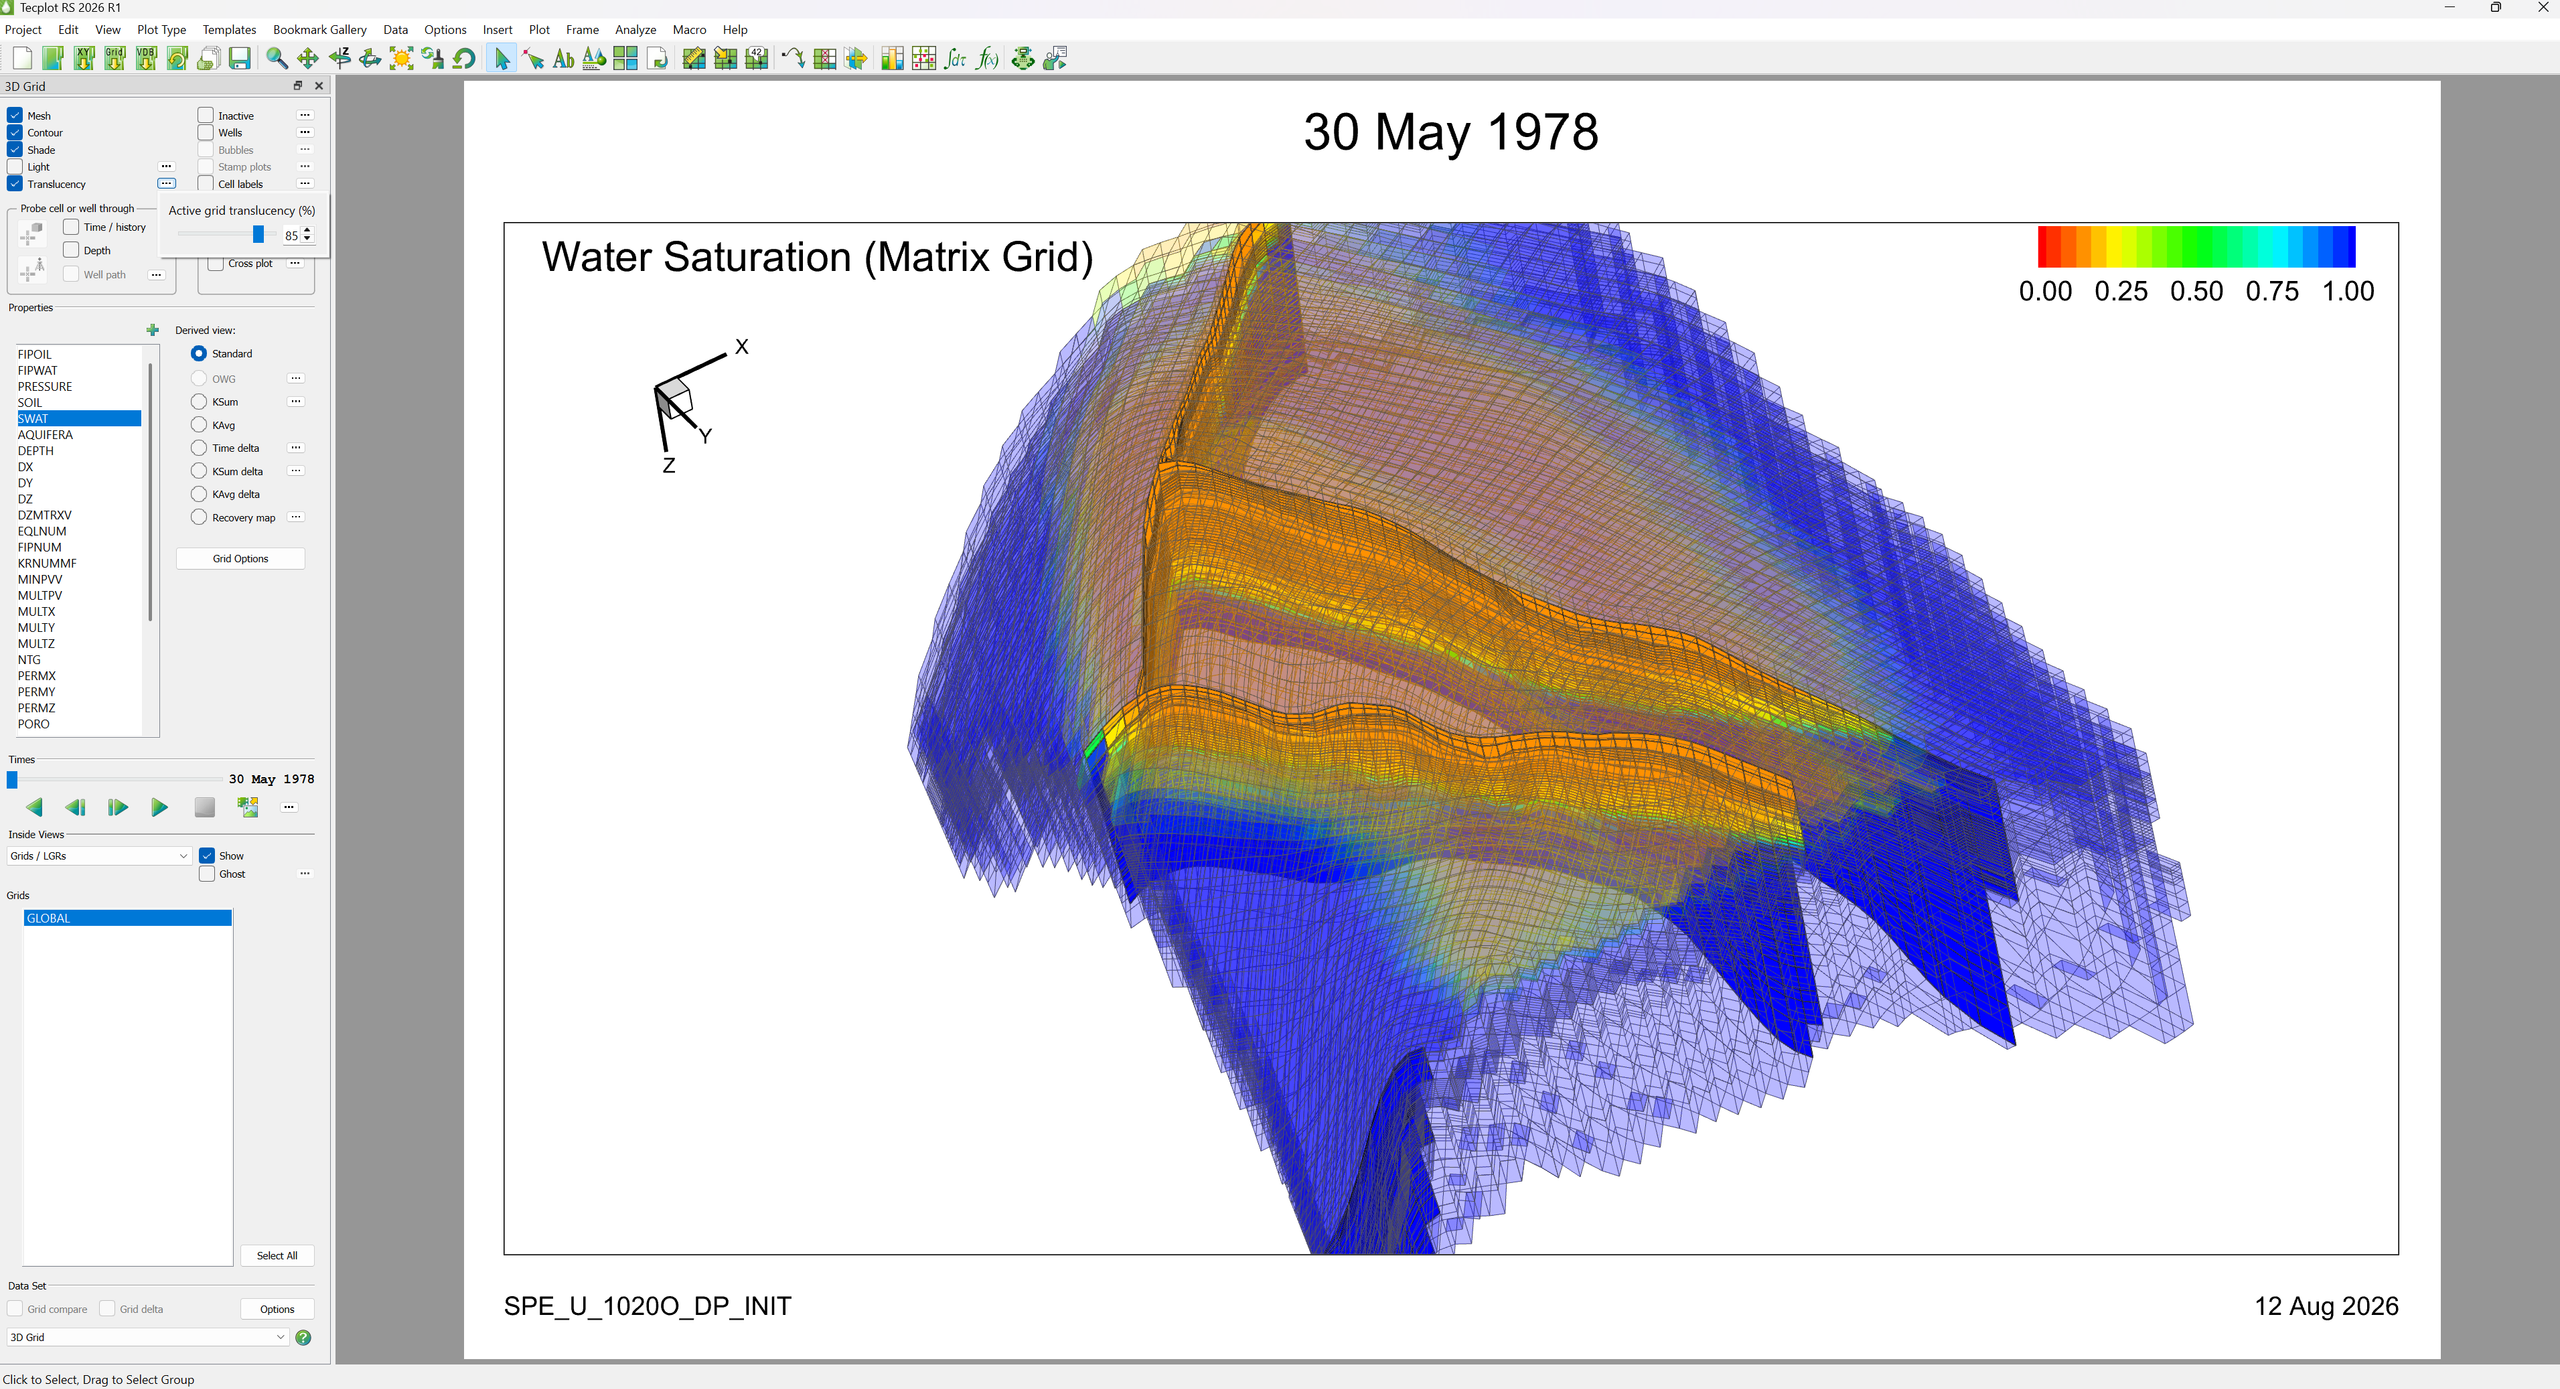
Tecplot RS can display defined faults directly with the reservoir model, and importantly, those faults can remain visible as you move into grid-based views and investigate simulation results. That means you don’t have to think about the fault geometry and the reservoir solution as two separate pieces of information.
You can look at a property distribution, saturation behavior, pressure response, or another simulation variable while still seeing exactly where the faults sit within the model. That spatial relationship can provide valuable clues when you’re trying to understand why the solution behaves the way it does.
The new transparency controls in 2026 R1 make these views even more useful.
By quickly adjusting transparency levels, you can expose the internal structure of the grid while retaining the fault geometry as a visual reference. You can build views where neither the grid nor the faults overwhelm the other, making it much easier to investigate how structural features relate to the simulated reservoir response.
Shaped by Our Users – 46 Years of Visualization Experience
Talking directly with users like you has played a huge role in shaping Tecplot RS and our other products. Your feedback helps us understand what you need to see and how you need to work with your data, and that helps us build better visualization tools. Good visualization should do more than show you your results. It should help you explore them, make connections, and uncover things in the data that would otherwise be difficult to see.
That feedback helped shape Tecplot RS 2026 R1. As simulation models grow in size and complexity, the tools used to analyze them need to keep up. This release continues our focus on making large models easier to work with, reducing the time it takes to reach important views and results, and improving the workflows reservoir engineers use every day.
So please, keep filling our inboxes and blowing up our phones. Tell us what works, what doesn’t, and what you want us to tackle next. That feedback has helped shape Tecplot for 46 years, and we want it shaping the next version too.
Download Tecplot RS 2026 R1 and put it through its paces. In particular, we’d love to hear from those of you working with large datasets: how does the new release perform with your models compared with previous versions? To send us your observations, benchmarks and the workflows where you see the biggest difference, reach out to r.olimuthu@tecpclot.com.