


 MENU
MENUAs we look forward to 2018 and beyond we’re excited to take part in an industry that never rests and is never satisfied. We’re eager to bring new ways to visualize increasingly complex and unsteady data, and provide new analysis features, while maintaining the Tecplot promises of giving engineers complete control over their output, fast post-processing speed, report-quality XY, 2D and 3D plots, and excellent stability, service and support.
A Look Back at the Porsche 956
On the first day of my first aeronautical engineering job after graduate school, I opened my desk drawer and found a small package of 35mm Kodachrome slides dating back to the early 1980’s (it was an old desk). The image below, likely pre-dating Tecplot entirely, is from those slides. Racing fans will know that it’s a model of a Porsche 956, a famous beast of a racecar from the Group C era of endurance motorsports.
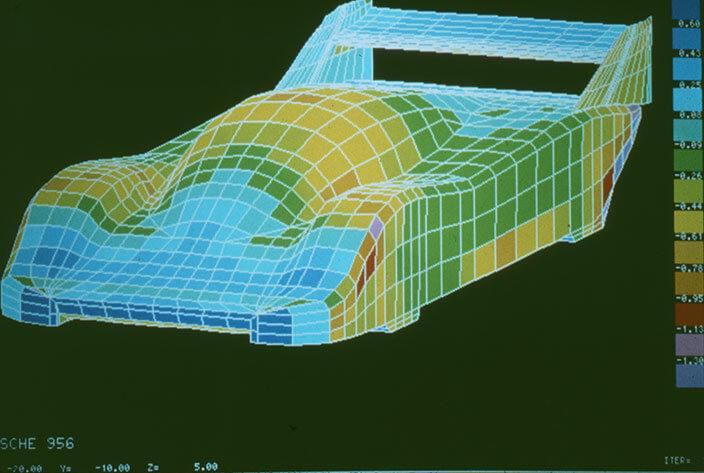
Flow simulation of a Porsche 956, circa 1982
Fluids experts will infer that it’s not even a “real” CFD solution. It’s from a potential flow code, and at that time, this simulation was likely run on a Cray X-MP and took hours, if not days, to complete. As I write in the waning days of 2017, I think of this image frequently and ponder how far our industry has come over the ensuing 35 years, and specifically how far Tecplot has come in 2017.
Visualize Increasingly Complex and Unsteady Data
In January we released Tecplot 360 2017 R1, with PyTecplot and SZL Server, and made Chorus available to all Tecplot 360 clients with active maintenance. This was the biggest change to Tecplot software in the past several years. Throughout the year we’ve added to PyTecplot, making it possible to control the Tecplot GUI and streamline workflows.
Additionally, in 2017 we have:
- Released a new and substantially improved version of our TecIO libraries.
- Significantly updated Tecplot 360 data loaders like Fluent, and added VTK support.
- Added text and equation precision to Tecplot plots with support for LaTeX fonts.
- Augmented our slicing and iso-surface capabilities.
- Enhanced our oil & gas reservoir visualization product, Tecplot RS, with RESQML and the Recovery Map.
- Updated our training materials, especially with the Tecplot 360 Getting Started web page.
- Eased learning new and commonly-used features by creating video tutorials.
It has been a big push by everyone at Tecplot, and the reason for this effort is clear: we don’t live in 1985 anymore and our clients need better tools with enhanced capabilities. Engineers create tens or hundreds of gigs of data overnight, both in the form of hundreds or thousands of simulations, and also extremely large simulations.
That isolated panel method solution is largely history, and in its place are ensembles that you can analyze in Chorus, billion-cell runs you can visualize with SZL (and remotely with SZL Server), and data of all forms that can be automated with PyTecplot to meet the increased expectations placed on engineers everywhere.
A big thank you to all our users and supporters for a great 2017, and stay tuned for much more.
 Blog by:
Alan Klug
Vice President, Customer Development
Tecplot, Inc.