Puget Sound Transect in Tecplot 360

Tecplot 360 2018 R2 Helps Geoscientists Analyze Simulated Data

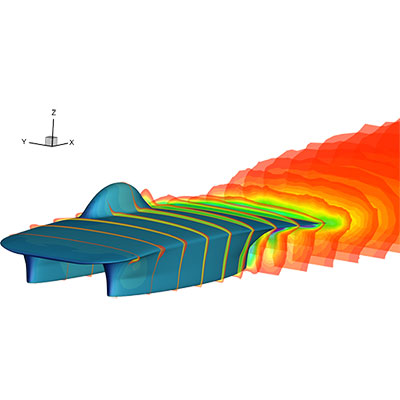
Tecplot, Inc. has announced the general availability of Tecplot 360 2018 Release 2. This release will benefit geoscientists who work with results from numerical models such as FVCOM, ROMS and WRF.

Unlike script-based post-processing, Tecplot 360 allows geoscientists to quickly view and analyze full 3D models in an interactive user interface – without the need to write scripts. Tecplot 360 allows a quick and thorough exploration of XY, 2D and 3D results, which ensures that important […]

» Read More


NASA Trap Wing

Comparison of Tecplot Data File Formats

Tecplot 360 performance has improved significantly in the last five years, however, the performance experienced by the user varies dramatically with the file format being read. Whenever we tell a developer that a customer is experiencing poor performance, their first question is always “What data format are they reading?”. I’m writing this blog to explain why. […]

» Read More


Quick XY (featured Image)

History Match Bubble Plots

Bursting the Bubble on Traditional History Matching Blog by Raja Olimuthu, Tecplot RS Product Manager The big problem with traditional history match workflows is that they are cumbersome. Doing a well by well analysis is time consuming, and it can be difficult to get a holistic view of your reservoir. A better way is to examine the history match spatially – that is in one view. I want to show […]

» Read More


Tecplot and Convergent Science Announce Partnership

CONVERGE licenses to include complimentary Tecplot 360 license, creating powerful and seamless CFD and visualization. BELLEVUE, WASHINGTON – May 31, 2018 – Tecplot is pleased to announce the formation of a new partnership with Convergent Science. As of June 1, each CONVERGE license will include a complimentary Tecplot license, giving CONVERGE users access to Tecplot 360’s powerful CFD visualization and analysis tools. “We are very excited to be partnering with […]

» Read More


Unsteady Data in Tecplot Files

Unsteady Data in Tecplot Files

What is the best way to represent unsteady data in Tecplot files? Tecplot divides datasets into zones. These zones may represent different areas of the physical domain, the same physical domain at different time steps, or different results that you may wish to compare. […]

» Read More