


 MENU
MENU
Postprocessing on AWS – Part 2: Saving Cost and Time
Welcome back for the second post in a series about running Tecplot 360 on Amazon Web Services (AWS) cloud compute resources. […]
Welcome back for the second post in a series about running Tecplot 360 on Amazon Web Services (AWS) cloud compute resources. […]
When it comes time to present your work to others, it’s important to remember that the purpose of the presentation is clear communication, and the goal is (usually) to make or defend a decision. […]
Whether you have an XY-line or contour plots, styling and formatting is critical in communicating your the results of your analyses. […]
Today we’re going to discuss how to tailor your plots and presentations based on your audience. The key to keeping your audience engaged is delving just deep enough to give context and confidence in your conclusions and recommendations. […]

This post is the first in a series about running Tecplot 360 on the Amazon Web Services (AWS) cloud compute resources. […]
Consistency in your plots is important because it helps you identify significant differences when comparing datasets or regions of the same dataset. […]
Learn how the Tecplot Europe engineering team can help you customize your solutions for CFD visualization and analysis. […]
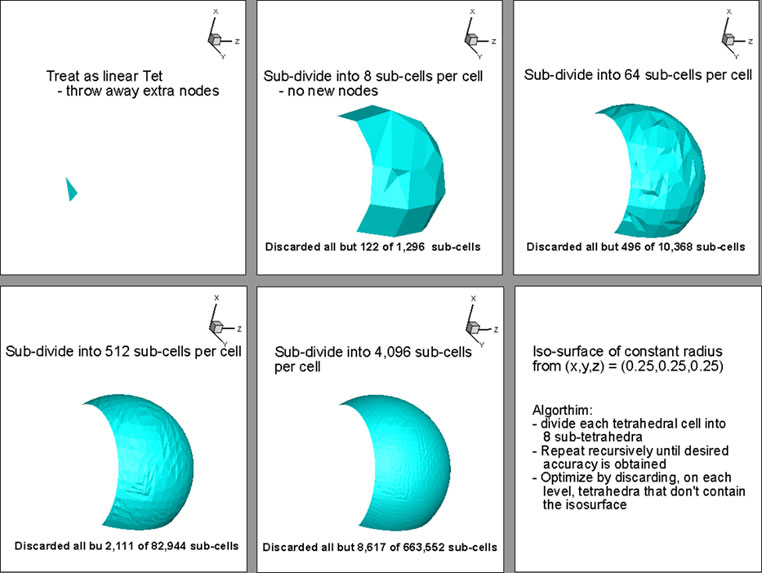
In this blog I will be discussing our research into isosurface algorithms for higher-order finite-element solutions. […]
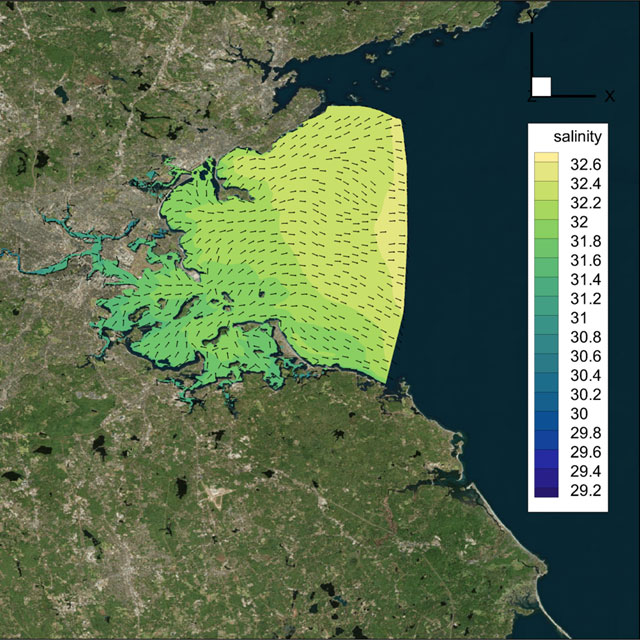
You asked some important questions during this training session using the FVCOM dataset for coastal and ocean modeling. Enjoy skimming the Q&A here to find something of interest. […]
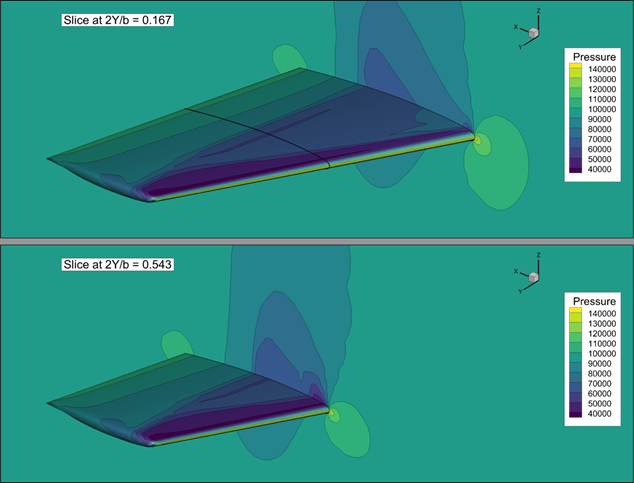
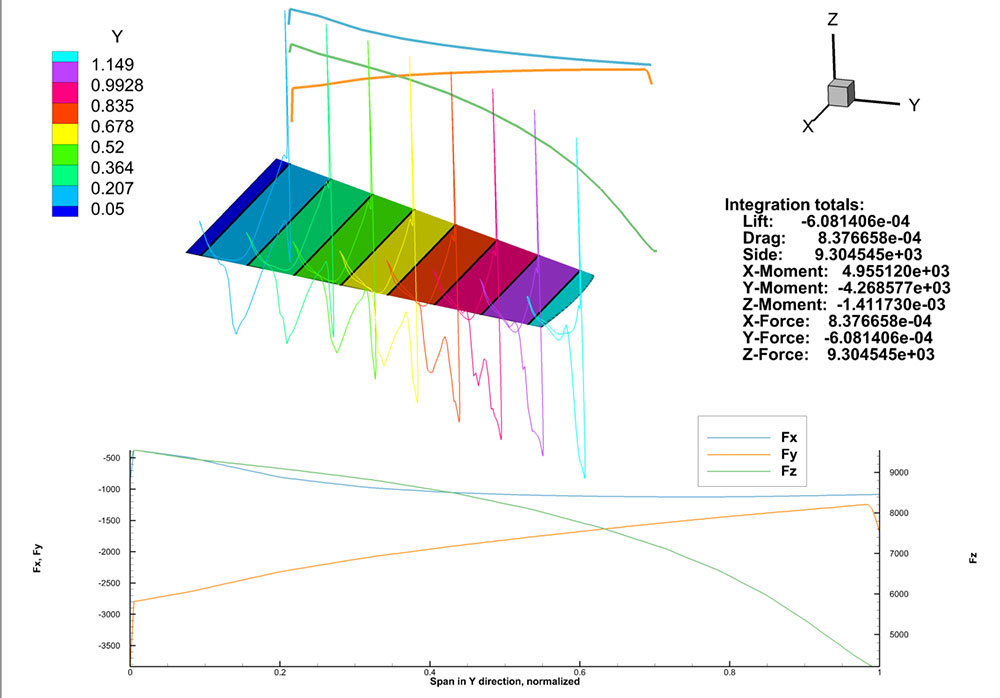
You asked some great questions during the Tecplot 360 Basics Online Training session using the ONERA M6 Wing data. Here are the answers! […]